Advanced Guide to Dynamic Data Processing
Original: https://cli.im/article/detail/2119
This article is an advanced guide to data processing, featuring tutorials on creating data visualization dashboards, monthly equipment inspection statistics reports, and more.
1. Inserting Images into Excel
During equipment or area inspections, photos of the equipment or site need to be collected. When exporting data, images, audio, and video files only provide online links and cannot be displayed directly within Excel cells, making archiving inconvenient. Refer to the tutorial below to insert images directly into cells.

2. Counting Participants and Non-Participants
In training scenarios, attendees are required to sign in upon arrival. After the training session, it's necessary to generate lists of participants and non-participants, with the latter being included in the roster for a second training session.
This method is also applicable to scenarios like material distribution or confirmation of announcements in the education sector.

3. Visual Dashboards - Data API Application Scenarios
After enabling the Data API feature, data from the CaoLiao platform can be automatically pushed to you. You can connect other applications to utilize this data for the following functionalities.
3.1 Creating Equipment Inspection Visual Dashboards
Use QR codes to create online profiles for equipment. Record detailed information during daily checks and maintenance by scanning the codes. Based on this, use the Data API and visualization tools to intuitively display equipment status, daily check results, details of abnormal equipment, maintenance records, etc.

3.2 Creating Order Process Flow Dashboards
We create reports to understand the latest progress/status of various orders, which requires access to order information and status details. Furthermore, to understand dispatch details and completion details, we need data on dispatch records and completion records for each process step.
This allows for quick queries into the latest progress of each order, identification of overdue orders, and focusing on orders nearing their deadlines.

3.3 Creating Inbound/Outbound Visual Dashboards
The CaoLiao platform does not support automatic calculation features, so real-time inventory quantities cannot be viewed directly. However, you can use external data analysis tools like Baidu Sugar, connected to the official CaoLiao database, to freely implement various calculations, including real-time inventory.

For more visual dashboard examples, click View Case Collection Page
3.4 Connecting WPS Multi-dimensional Tables to Database
WPS Multi-dimensional Tables now support database connections (free for a limited time). Data collected via CaoLiao can be pushed into WPS Multi-dimensional Tables, allowing free use of the data to build desired dashboard content.
Data from different forms can be linked to the same WPS Multi-dimensional Table to create dashboard views.
3.5 Connecting Feishu Multi-dimensional Tables to Database
Feishu Multi-dimensional Tables now support database connections. Data collected via CaoLiao can be pushed into Feishu Multi-dimensional Tables, allowing free use of the data to build desired dashboard content.
Feishu Multi-dimensional Tables Pricing Note: Supports a one-month trial. The free version allows pushing data to only three tables, with a synchronization limit of 1000 rows. If needed, you can purchase the Advanced version (¥2499/year) or Enterprise version (¥5499/year).
3.6 Pushing Form Data Directly to WeCom, DingTalk, or Feishu Group Chats
When a form created in CaoLiao is filled out and submitted by a user scanning the code, this information can be automatically and immediately pushed to designated group chats in WeCom, DingTalk, or Feishu, enabling instant sharing and communication to enhance team collaboration efficiency. Currently, pushing to individual users separately is not supported.
3.7 Integrating Form Data with Tencent Docs
Form data can be integrated with Tencent Docs, allowing real-time synchronization of CaoLiao data into Tencent Docs' Smart Tables.
4. Creating Equipment Inspection Record Summary Reports
At the end of each month, companies often need to export and summarize equipment inspection records for that period. This involves creating monthly equipment inspection record reports for archiving or reporting purposes.
After exporting inspection data, here are two methods for monthly reporting:
4.1 Creating Monthly Equipment Inspection Summary Reports
Directly displays the daily inspection results (Normal/Abnormal) for each piece of equipment.

4.2 Creating Monthly Inspection Reports for a Single Equipment
Displays the detailed monthly inspection status (Normal/Abnormal) for each check item of a specific piece of equipment.

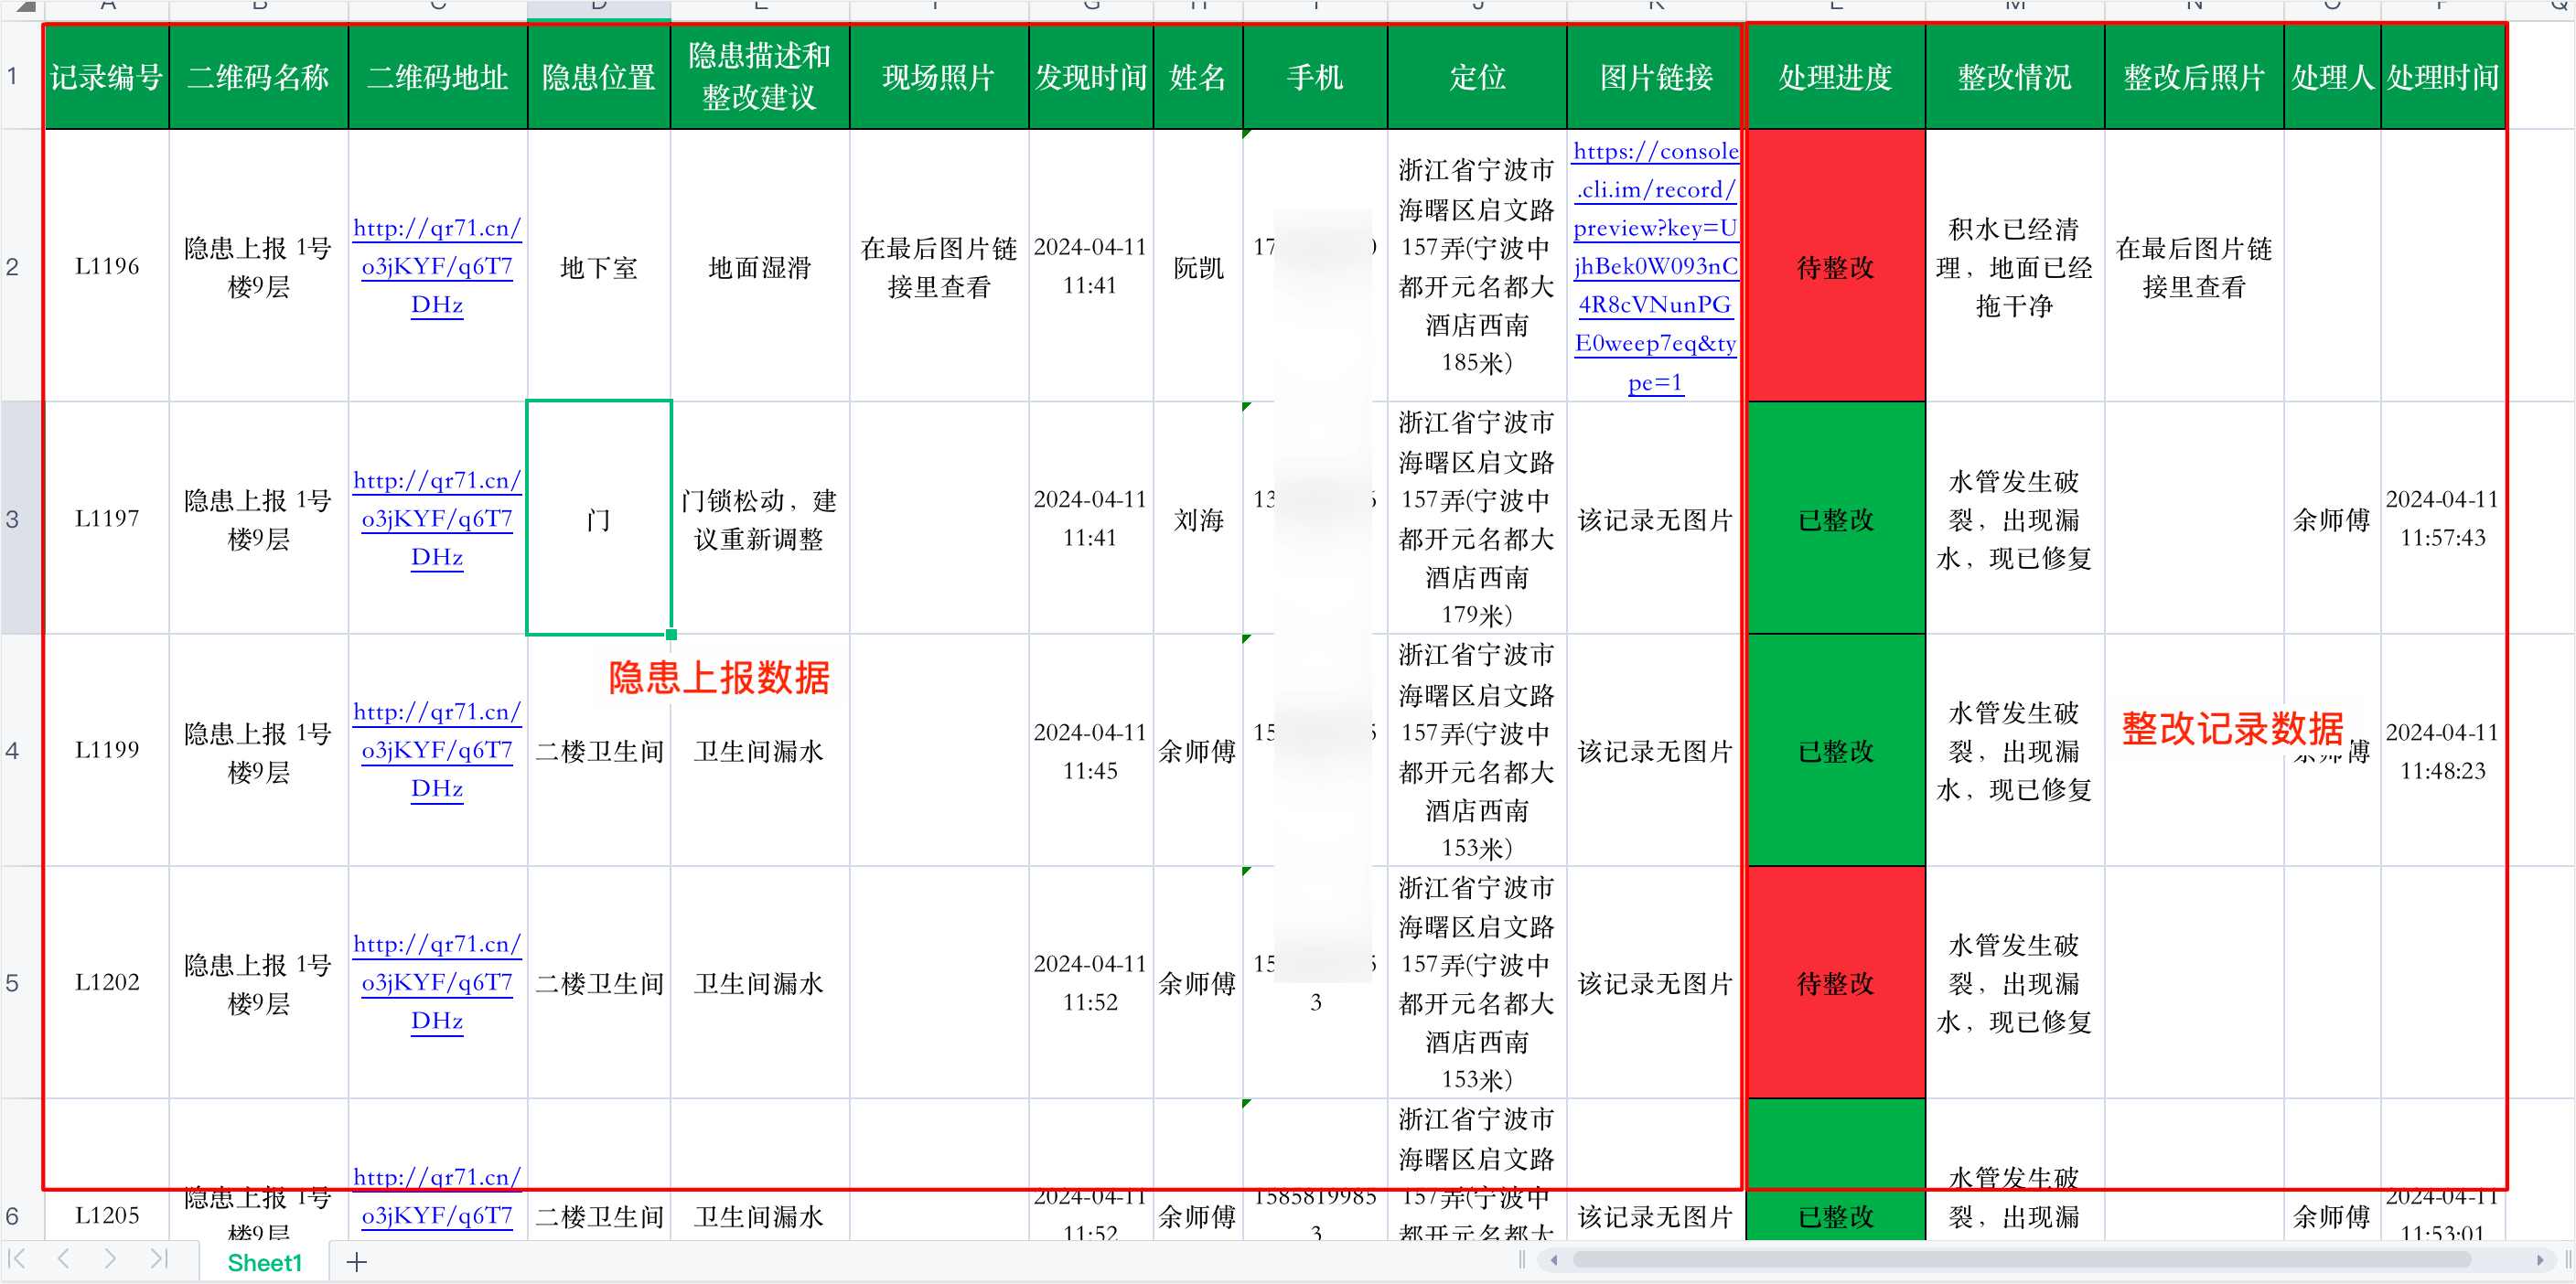
5. Integrating Hazard Reporting - Rectification Data
When using CaoLiao for hazard reporting and rectification processes, it's common practice to add a 'Rectification Record' form as a follow-up action within the 'Hazard Report' form. This links the hazard report with its rectification record, forming a closed loop.
Companies or property management parks often need to summarize safety hazard reports and rectification statuses at month-end, requiring data where one row represents one complete hazard report - rectification record cycle for easier tracking and archiving.